
Introduction to database connections in Excel for efficient risk control - Part 1
Part 1: How to make automatic reports

Introduction:
Microsoft Excel and SQL database are the basic tools of data analysis. Regular tasks like management reporting or generation of call lists need to be automatized as much as possible in order to minimize human mistakes and save your team’s valuable time. In this article, we will raise an example to teach you (or your team members) how to connect SQL to EXCEL and explain how this can save the time and improve the efficiency of your team.
In this article, we use EXCEL2010 and SQL Server 2014 Management Studio as the example. There are some small differences between different versions. For Oracle users, we have some explanation at the end of the step2.
STEP1: Clarify our purpose & Prepare the SQL table
It is easy for analyst to prepare the table in SQL, so we skip the process.
In our example, we suppose we have a table named ‘example_loans’ with data regarding loans of a consumer finance company. We have 5 columns: id, gender, loan_amount, data_source (online or offline), and loan_type. And we have 10000 records, one record corresponding to one loan contract. And what we want is to get the general idea of the distribution of customer loan amount according to gender, type and source.
STEP2: Connect to EXCEL
For SQL Server user:
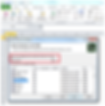
Open excel -> Data -> From Other Sources -> From SQL Server (1st option):

Then the following window appears:

You should input the same server name, log in account and password as the one you use to log in the SQL Server.
Then you should choose the database that contains your table, and find the table you want:
Then click ‘finish’:

Then we can choose whether we want to import it as the table or as pivot table:

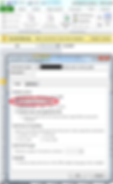
Then we will be asked to fill in SQL user name and password again:

Finally, we finish the connection step, and get the interface like this:

For Oracle SQL user:
Basically, the process is the same for Oracle users, but before the connection, we need to create ODBC connection to the database in Windows:
Open Control Panel -> Management tools -> ODBC -> ADD -> Oracle SQL -> Create a name and description, fill in the server name -> Use SQL username and password to log in -> Change the database -> Finish
Then we choose the ODBC connection in EXCEL: Other data source -> From Data Connection Wizard -> Finish
STEP3: Generate the table & chart
First, generate the Pivot Table:

Here, we want to know the loan amount for different loan types and gender of customers from different sources. So we choose the filter as source of data, loan type as the column label, and gender as the row label. Before we do this, we have 5 columns multiplied by 10000 rows of data. But now, we can get the rough idea about this data just in a small table.
If we insert a chart, it is even much visualized:

So just by one glance we can get the idea about what our data likes.
If the original data from database is not what you want, for example, in our case, you want to get a rough idea about the distribution for customers with loan_amount larger than 2 thousand. You can change the range:
(EXCEL tool bar) Data -> Property -> Definition -> Change the command type to SQL & add your condition in command text:

Using this approach, you can fetch the results of any SQL query from the database into excel, for example join tables together and/or aggregate them by GROUP BY clause.
STEP4: Dynamic table
Method1: manually refresh it
By just one click on the ‘Refresh’ button, we get the updated table according to the change of the database.

Method2:
(EXCEL tool bar) Data -> Property -> Usage
You can choose the automatic refresh option and its frequency:
Wrap-up:
For analyst who read this article, you are responsible not only for analyzing data and managing database, but also for reporting to manager and assisting IT’s job to provide information to operators, who prefer visual and interactive interface.
In our simple example, we get the general idea of the distribution of customer loan amount according to gender, type and source. And we can refresh it anytime we want automatically. In this way, we can minimize human mistakes, save the time and improve the efficiency of the whole team at the same time.
The above described approach executes a fixed select query in the database. Sometimes, however, we want to run a query which adapts dynamically according to user’s input. We will examine how to solve this task with VBA (Visual Basic for Applications) in the second part of this article.


